For our second assignment, we were to use an infographic to show statistics about something we were interested in.
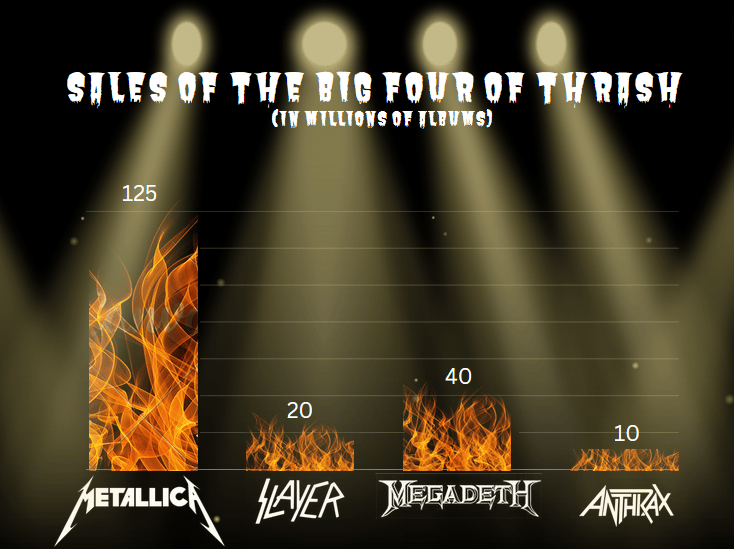
I decided to compare the worldwide album sales (in millions of copies) of the Big Four of thrash metal: Metallica, Slayer, Megadeth, and Anthrax. I knew Metallica would clearly be the winner, but I wanted to know how successful the other three bands were in comparison, and if they really were in the same league commercially. I went with a simple background, using plain black and a stage light overlay so the graph wouldn’t be too cluttered. I used a bar graph to illustrate the album sales, with the bars in black and transparent clip art of fire over them to emphasize the metal aesthetic. I also used the band’s logos instead of just the names for the same reason. The numbers above each of the bars represent the bands’ album sales in millions, since the shape of the flame may make it difficult to read the exact numbers.
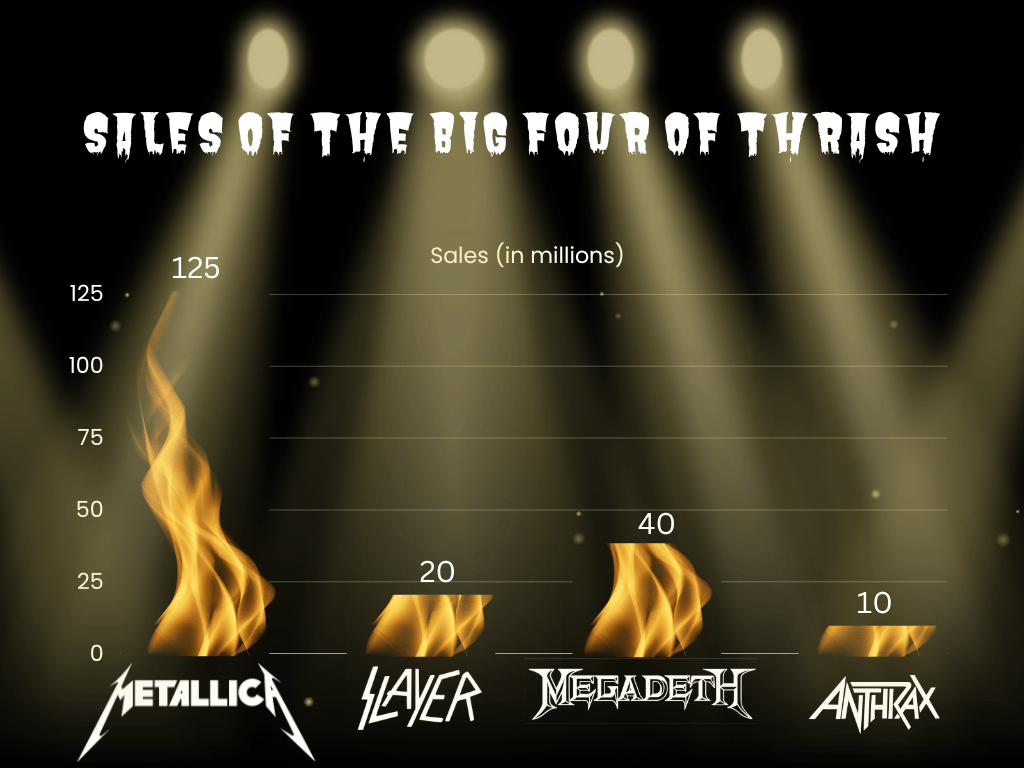
While reviewing in class, I received advice about how to improve, specifically by keeping one set of numbers (either the y-axis or the numbers above the bars) and making the flames on the other bars shorter instead of just cutting them off. As I redid it in Canva, I decided to keep the numbers above the bars instead of the y-axis, and I changed the flame graphic altogether to make it easier to see and work with. On top of this, I added “(in millions of albums)” under the title so I could do away with the legend altogether and keep it simple to look at.


Leave a Reply